On-the-fly map tiling with Go and LeafletJS
TL;DR
I made a demo project of how to use Golang to produce the map tiles for use in LeafletJS’s tile layer. I did it mainly to catalog how I managed to solve a few of the issues I had faced in a real-world project, just in case it would be useful to someone (future me included).
Some of the things I had to solve were:
- How to tile map images on the fly in Go
- How to cope with updating the image for a given area (e.g. new satellite image)
- Handling large images (and caching on the filesystem)
You can find the code on GitHub. I would suggest you clone the repo and have a go running the server.
Understanding the demo
Seriously, I think you’ll get a lot more of just cloning and running the server, but I’ll explain some details here (it’ll take a little while, as there are some large images included).
> git clone https://github.com/andrewdodd/leaflet-go-map-tiling
~~~ follow instructions for installation in Readme ~~~
> cd leaflet-go-map-tiling
> go run serverd.go
> open http://localhost:8000 ....well, maybe just do this in a browser
In order to demonstrate some of the things I found, I decided to search for a collection of very large map images from the web (the reason will become more obvious later).
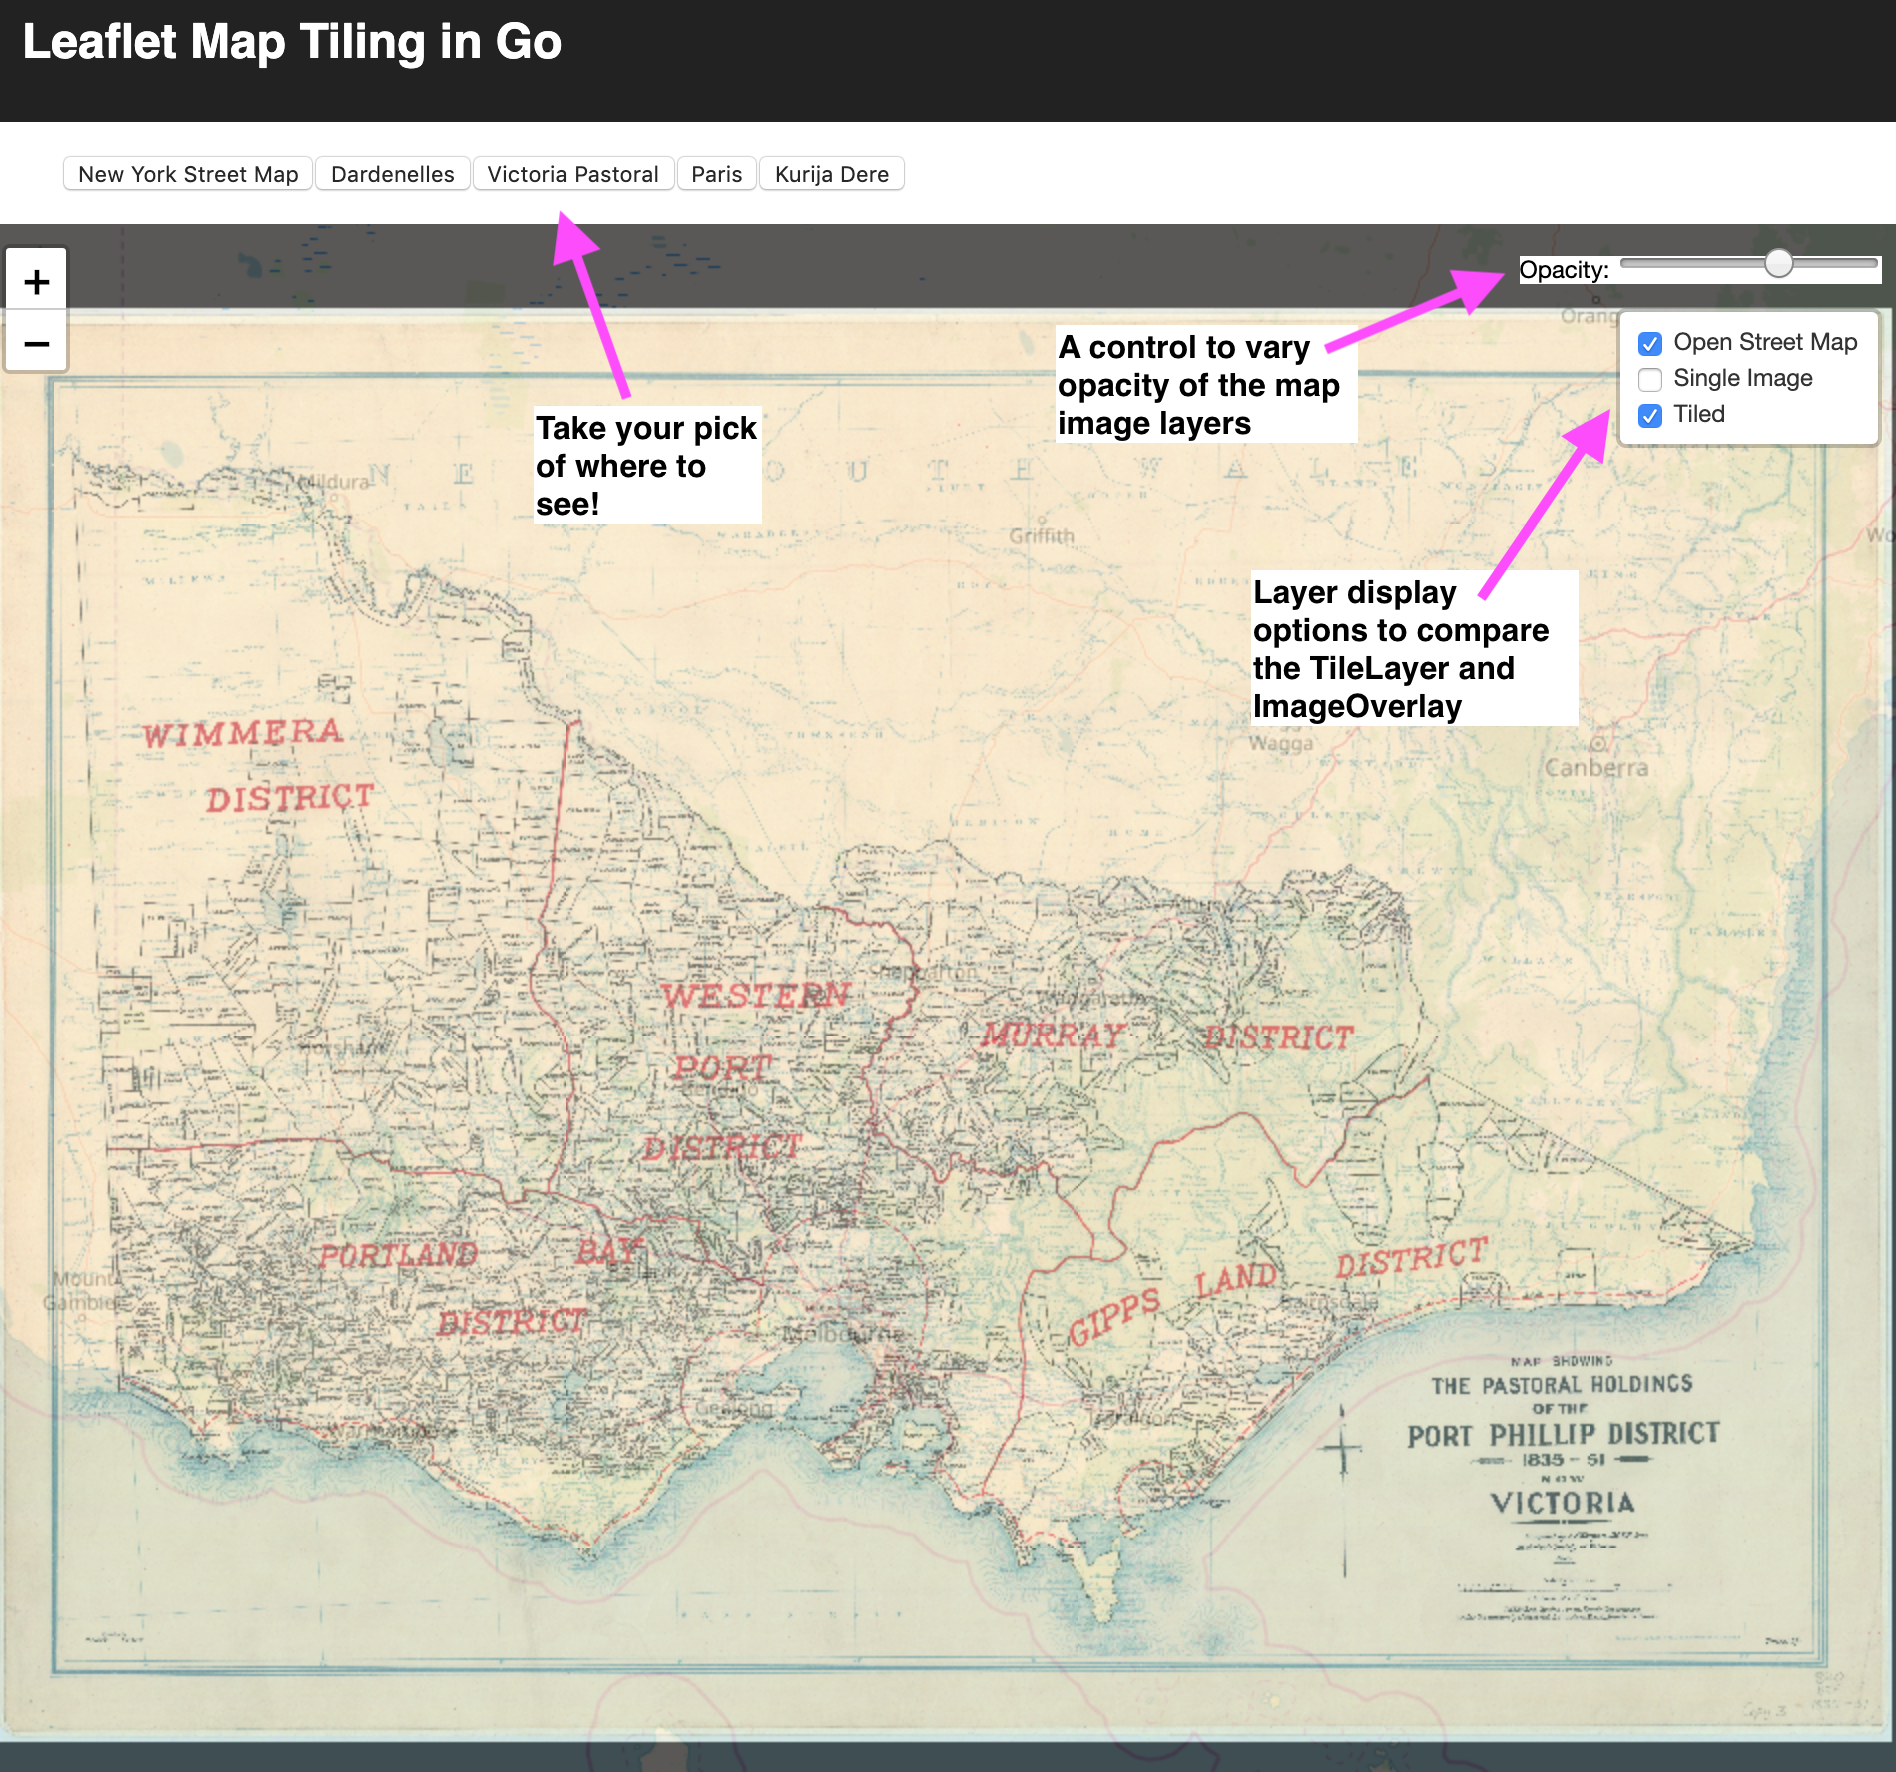
You can see a screen shot of the UI below. It’s not pretty (it’s not really meant to be), but you can change the map image being viewed, the opacity of the custom image layers, and two different methods for displaying a custom image (the TileLayer and ImageOverlay), so you can compare the implementations and the underlying “Open maps” tiles.
Careful with the Single Image layer…it can be really slow
So what is interesting
The interesting things are mostly in the code, but I will briefly cover:
- How to use an affine transformation to be able to map from pixel coordinates to geographical coordinates.
- How to use this transformation to convert from the LeafletJS / Google maps / TMS URI format, through geographic coords, to select the correct square from the source image.
- How to use extract this square into its own small image (and why you might want to use a libvips wrapper like bimg to do this image processing).
Handling the pixel to geographical transformation
In order to cope with updating an image for a given area (e.g. someone exports a new map from their favourite GIS / CAD program), you need a way to know how the pixels in the image correspond to locations in the world (or at least in the geographical projection you are using the LeafletJS).
This allows you to cope with things like changing image resolution, aspect ratio and translation. A bit of Googling and Wikipedia led me to Map Projection. A bit more led me to this PDF from the Bentley Systems community (I’m not really sure who Bentley are) and I thought I had struck gold.
The PDF outlined how to do conformal transformations, which sounded like the thing I wanted, so I diligently implemented this in JS only to find that the actual transformation I wanted was an affine transformation (but without the ability to do rotation). A more careful reading of the LeafletJS docs would probably have revealed this to me: “Transformation represents an affine transformation…” (https://leafletjs.com/reference-1.5.0.html#transformation)
So what does this affine transformation do? And why without rotation?
The transformation allows the code to locate and stretch the provided image, so that it overlays the area of the map correctly. This is because LeafletJS is controlling how the “viewport” is behaving, based on the zoom level, and the location that is currently panned to. In order to correctly use an ImageOverlay, we need to provide the bounding coordinates of the image as geographic points, not pixels.
LeafletJS is unable to place ImageOverlay objects with any rotation, it’s just something that is not supported out-of-the-box (there are plugins for it). This is the reason for the no rotation.
How to calculate this stuff?
There are plenty of resources available that explain this process (from people far more knowledgable than me). However, the general idea is to solve the matrix equation that allows you to convert from one coordinate space to another.
The code in the GitHub repo that performs this is pretty straightforward to follow (hopefully my matrix drawings are correct). The general idea is either you know the “Scale” and “Translate” parameters for your transformation, OR you have to calculate them. To calculare them you can supply the coordinates of two identical points in each coordinate system and solve the system of linear equations to obtain the “Scale” and “Translate” parameters.
That is what this does (see affinenorotation.go):
func NewAffineNoRotTransformationFromPoints(standardPoints []Point, localPoints []Point) (AffineNoRotTransformation, error) {
	n1, e1 := standardPoints[0].Lat, standardPoints[0].Lng
	n2, e2 := standardPoints[1].Lat, standardPoints[1].Lng

	E := mat.NewDense(4, 1, []float64{e1, n1, e2, n2})
	y1, x1 := localPoints[0].Lat, localPoints[0].Lng
	y2, x2 := localPoints[1].Lat, localPoints[1].Lng
	X := mat.NewDense(4, 4, []float64{
		x1, 0, 1, 0,
		0, y1, 0, 1,
		x2, 0, 1, 0,
		0, y2, 0, 1,
	})

	//          X         *    t    =    e
	//   --------------       ----      ----
	//  | x1  0  1  0  |     | Sx |    | e1 |
	//  |  0 y1  0  1  |  *  | Sy | =  | n1 |
	//  | x2  0  1  0  |     | Tx |    | e2 |
	//  |  0 y2  0  1  |     | Ty |    | n2 |
	//   --------------       ----      ----

	var trans mat.Dense
	// https://en.wikipedia.org/wiki/System_of_linear_equations
	// Expressed in the form Ax=b (or Xt=e)
	// I.e. solve for T
	// T = X^-1 * E
	err := trans.Solve(X, E)
	if err != nil {
		return AffineNoRotTransformation{}, err
	}

	return AffineNoRotTransformation{&trans}, nil
}
How to select the right square
The TileLayer from LeafletJS uses a templated URI that produces a request for a map tile. The details of how this works and why it is done this way are excellently described by MapTiler.com here.
I actually did an “as needed” port of the Python functions found in the globalmaptiles.py file. You can see the whole file here, but this function illustrates the function that determines the geographical bounds of a square given by the TMS/Google map template URI:
func TileLatLonBounds(tx, ty, zoom int64) (a, b Point) {
	//"Returns bounds of the given tile in latutude/longitude using WGS84 datum"

	bounds := TileBounds{}
	bounds.FromTile(tx, ty, zoom)
	minLat, minLon := MetersToLatLon(bounds.minX, bounds.minY)
	maxLat, maxLon := MetersToLatLon(bounds.maxX, bounds.maxY)

	a = Point{Lat: minLat, Lng: minLon}
	b = Point{Lat: maxLat, Lng: maxLon}
	return
}
This was used, in conjunction with the affine transformation to identify the pixel bounds of the square:
func (i goImage) PixelFromGeo(p LatLng) LatLng {
	return LatLng(i.toPixel.Project(p.toPoint()))
}

func (ii goImage) MapTile(zoom, x, y int64) io.ReadSeeker {
	tileMin, tileMax := TileLatLonBounds(x, y, zoom)
	pxlMin := ii.PixelFromGeo(LatLng(tileMin))
	pxlMax := ii.PixelFromGeo(LatLng(tileMax))
    ... etc
Huzzah!
How to extract that square!
The next step for me was to figure out how to tile the images. The image files I had were only 10-20 MB, so I started by just using the go image library functionality and making a tile layer that created coloured tiles, just to get to understand the way the tile layers work. The code can be seen in the mapimage/debug.go file here.
A simple implementation in Go looks something like:
import (
"golang.org/x/image/draw"
"image"
"math"
)
...
func (ii goImage) MapTile(zoom, x, y int64) io.ReadSeeker {
tileMin, tileMax := TileLatLonBounds(x, y, zoom)
pxlMin := ii.PixelFromGeo(LatLng(tileMin))
pxlMax := ii.PixelFromGeo(LatLng(tileMax))
tileSize := image.Rect(0, 0, 256, 256)
img := image.NewRGBA(tileSize)
tileRect := image.Rect(
int(math.Round(pxlMax.Lng)),
int(math.Round(pxlMax.Lat)),
int(math.Round(pxlMin.Lng)),
int(math.Round(pxlMin.Lat)),
)
scaler := draw.ApproxBiLinear
scaler.Scale(img, tileSize, theImageSomehow, srcRect, draw.Over, nil)
return img
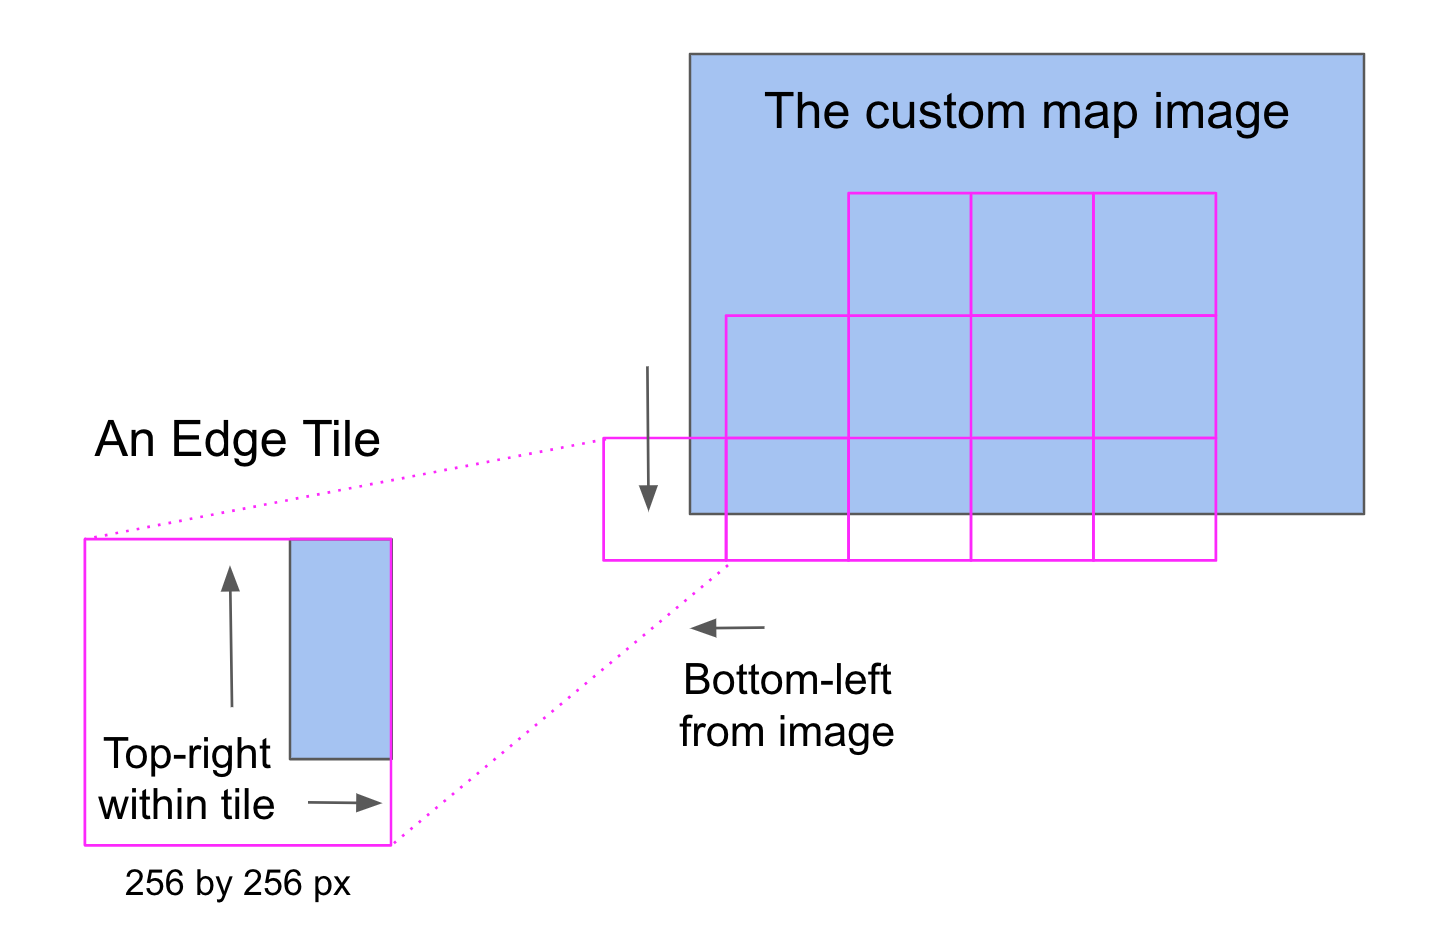
}One gotcha was that if part of the tile you need to extract from the image falls outside the bounds of the image, you need to be a bit careful with the destination in the tile image, otherwise weird stuff can happen (like getting the source images’ background colour as the colour of tiles that are completely outside the source image!).
The image here shows the issue:
Which is obviously not too onerous to deal with. The Go image backed implementation is implemented in mapimage/goimage.go, and has the following implementation:
func (ii goImage) MapTile(zoom, x, y int64) io.ReadSeeker {
	tileMin, tileMax := TileLatLonBounds(x, y, zoom)
	pxlMin := ii.PixelFromGeo(LatLng(tileMin))
	pxlMax := ii.PixelFromGeo(LatLng(tileMax))

	tileSize := image.Rect(0, 0, 256, 256)
	img := image.NewRGBA(tileSize)

    // Make the default tile Black
	draw.Draw(img, img.Bounds(), &image.Uniform{color.Black}, image.ZP, draw.Src)

	tileRect := image.Rect(
		int(math.Round(pxlMax.Lng)),
		int(math.Round(pxlMax.Lat)),
		int(math.Round(pxlMin.Lng)),
		int(math.Round(pxlMin.Lat)),
	)

    // Only do calculations / scaling etc if the tile actual overlaps the image at all
	imgBounds := ii.image.Bounds()
	if imgBounds.Overlaps(tileRect) {
		srcRect := image.Rect(
			max(tileRect.Min.X, imgBounds.Min.X),
			max(tileRect.Min.Y, imgBounds.Min.Y),
			min(tileRect.Max.X, imgBounds.Max.X),
			min(tileRect.Max.Y, imgBounds.Max.Y),
		)

        // Cope with tiles that are not entirely within the source image
		dstRect := tileSize
		if srcRect.Max.X != tileRect.Max.X {
			// Reduce the right hand side of dstRect by the same ratio
			dstRect.Max.X -= int(float64(tileSize.Dx()) * (float64(tileRect.Max.X-srcRect.Max.X) / float64(tileRect.Dx())))
		}

		if srcRect.Min.X != tileRect.Min.X {
			// Increase the left hand side of dstRect by the same ratio
			dstRect.Min.X += int(float64(tileSize.Dx()) * (float64(srcRect.Min.X-tileRect.Min.X) / float64(tileRect.Dx())))
		}

		if srcRect.Max.Y != tileRect.Max.Y {
			dstRect.Max.Y -= int(float64(tileSize.Dy()) * (float64(tileRect.Max.Y-srcRect.Max.Y) / float64(tileRect.Dy())))
		}

		if srcRect.Min.Y != tileRect.Min.Y {
			dstRect.Min.Y += int(float64(tileSize.Dy()) * (float64(srcRect.Min.Y-tileRect.Min.Y) / float64(tileRect.Dy())))
		}

		//scaler := draw.BiLinear
		//scaler := draw.NearestNeighbor
		scaler := draw.ApproxBiLinear
		scaler.Scale(img, dstRect, ii.image, srcRect, draw.Over, nil)
	}

	w := bytes.Buffer{}
    // Always return the tile as a PNG
	png.Encode(&w, img)
	return bytes.NewReader(w.Bytes())
}
This uses the golang.org/x/image/draw package’s scaler to scale the in-memory source image (here in ii.image) onto the new img tile. It is super fast, given that Go’s image package holds the whole image in a convenient memory structure for such operations.
But so why implement an alternative with BIMG?
Although the demo project runs just fine, the out-of-the-box Go image package also uses a lot of RAM if the file has very large resolution. A thumb-suck estimate is that it uses about 3 bytes per pixel (assuming no palette optimisations etc etc). This might be fine for you, or this might not, I found that sometimes it was unsuitable.
A possible solution to this is to use a library like libvips, which “runs quickly and uses little memory”. I have included an alternative implementation of the MapImage interface that uses the bimg wrapper to offer a less RAM-intensive option. If you would like to see this in action you’ll need to install libvips (follow the instructions in the github repo), and lower the 1000MB threshold in the serverd.go file (line 66):
var mi mapimage.MapImage
if approxSize > 1000 { // change threshold here
...
Why add the filesystem caching
If you do switch the code to use libvips you will notice that the images are significantly slower to load (be sure to clear your browser cache). This is just natural, as libvips aims to have a low RAM footprint, and I guess it achieves this by being more computationally expensive. Also, you will notice that the server is much faster to start if all images use libvips (as the initialisation doesn’t have to unpack the large images into RAM like the Go image implementation does).
The good thing about these tiling systems is that they are idempotent…i.e. an HTTP request for the image at http://localhost:8000/api/file/tms/new-york/10/301/639 should return the same image every time. Computing these images over and over again is a bit of a waste, so it is possible to cache the results to the hard disk and serve the file from there.
You can see I only use the filesystem caching for the libvips implementation:
log.Printf("Using VIPS for %v\n", loadedImage.Filename)
mi = mapimage.NewVIPSImageInfo(
    loadedImage.Id,
    loadedImage.Name,
    loadedImage.ReferencePoints,
    f)
mi = mapimage.FilesystemCachedImage(mi)
Want to load your own images…
It’s not too tricky to load your own images into the demo project. Here’s the steps for getting this wonderful image to display…
- Download this 1851 Rees map of Chicagoland and save it as “1851_Rees_map_of_Chicagoland.jpg” in the
./images/folder. - Select two reference points, and find their geographic and pixel locations (I’ve done it for you below).
Add a record in the
images/config.yamlfile for your new image, just like this:- id: chicago name: Chicago filename: 1851_Rees_map_of_Chicagoland.jpg referencePoints: - geo: {lat: 41.88886030788814, lng: -87.62519359588623} pixel: {lat: 5359, lng: 10195} - geo: {lat: 41.531866, lng: -88.092095} pixel: {lat: 11142, lng: 4446}Then restart the server.
Other LeafletJS Gotchas
In case you made it this far, and you are interested, some other gotchas include:
- LeafletJS does not allow PDF or SVGs to be used as image overlays (well…not without serious contortion)
- PDF is really not well supported in JS-land…and/or it is a bit of a woolly beast
- Mobile devices really do not like dealing with large images as overlays (tbh, desktops don’t either), hence the TileLayer is a MUCH better choice overall (for any image about about 0.5 MB)
- And as a bonus…when using self-signed certificates (i.e. not-secure-HTTPS) browsers (cough Chrome) do not cache media (so if you display large images as a single ImageOverlay the browser downloads it all the time).
Conclusion
I hope someone finds this useful…leave a comment or a star on the repo if you do!